


Purpose
The Dashboard provides a high-level overview of inventory and sales information available in the system. It displays summary metrics and graphical widgets to help users monitor business activity from a single screen.
Note: The screenshot provided displays all values as 0, indicating that no transactional data is currently available.
Navigation
Dashboard
The Dashboard is the default landing page after logging into the application.
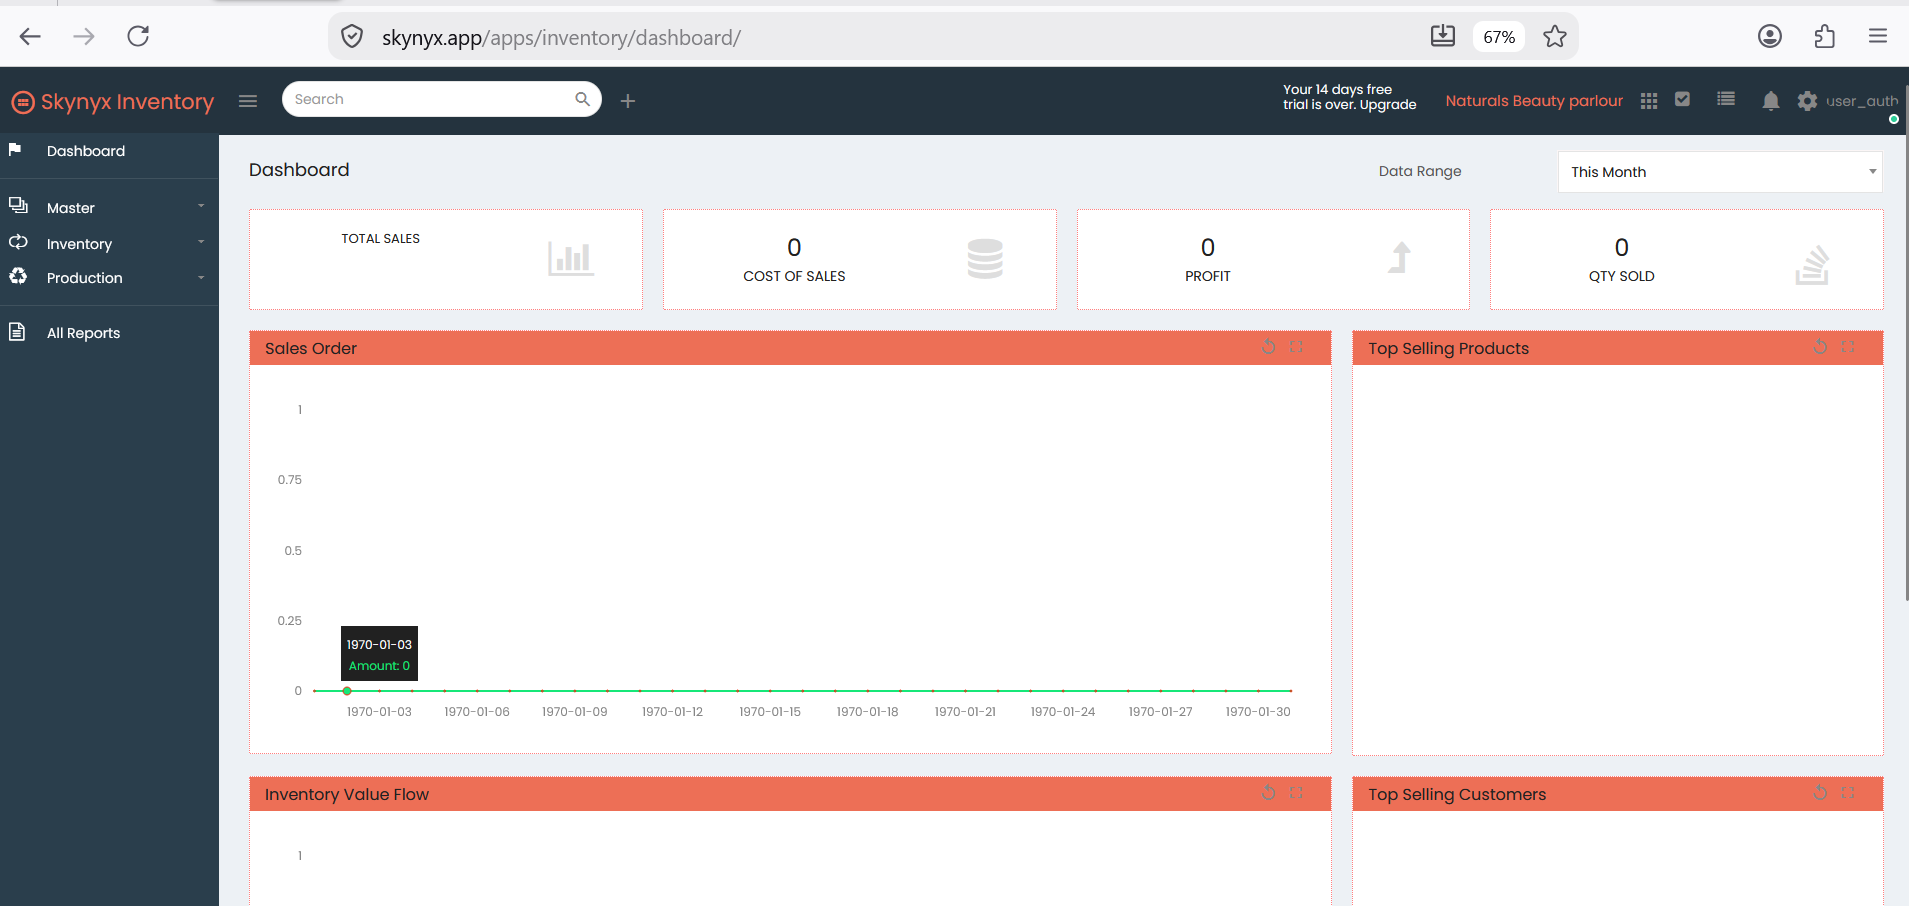
Dashboard Layout
The Dashboard contains the following sections.
1. Summary Cards
Four summary cards are displayed at the top of the page.
| Widget | Description |
|---|---|
| Total Sales | Displays the total sales value. |
| Cost of Sales | Displays the total cost of sales. |
| Profit | Displays the calculated profit. |
| Qty Sold | Displays the total quantity sold. |
2. Date Range Filter
A Date Range dropdown is available in the upper-right corner.
Visible option
- This Month
This filter is intended to change the dashboard data based on the selected period.
Only "This Month" is visible in the provided screenshot. No additional options are documented.
3. Sales Order
Displays a chart titled:
Sales Order
The chart area is available for viewing sales order information.
4. Top Selling Products
Displays a widget titled:
Top Selling Products
This section is intended to display the top selling products.
No records are shown in the provided screenshot.
5. Inventory Value Flow
Displays a chart titled:
Inventory Value Flow
This section provides a graphical view related to inventory value.
No data is displayed in the provided screenshot.
6. Top Selling Customers
Displays a widget titled:
Top Selling Customers
This section is intended to display the top customers based on sales.
No records are shown in the provided screenshot.
Dashboard Workflow
Step 1
Log in to the application.
Step 2
Open the Dashboard.
Step 3
Review the summary cards:
- Total Sales
- Cost of Sales
- Profit
- Qty Sold
Step 4
Select the required Date Range (only This Month is visible in the provided screenshot).
Step 5
Review the available dashboard widgets:
- Sales Order
- Top Selling Products
- Inventory Value Flow
- Top Selling Customers
Available Dashboard Components
| Component | Available |
|---|---|
| Total Sales | Yes |
| Cost of Sales | Yes |
| Profit | Yes |
| Qty Sold | Yes |
| Date Range | Yes |
| Sales Order Chart | Yes |
| Top Selling Products | Yes |
| Inventory Value Flow | Yes |
| Top Selling Customers | Yes |