


Event Analytics
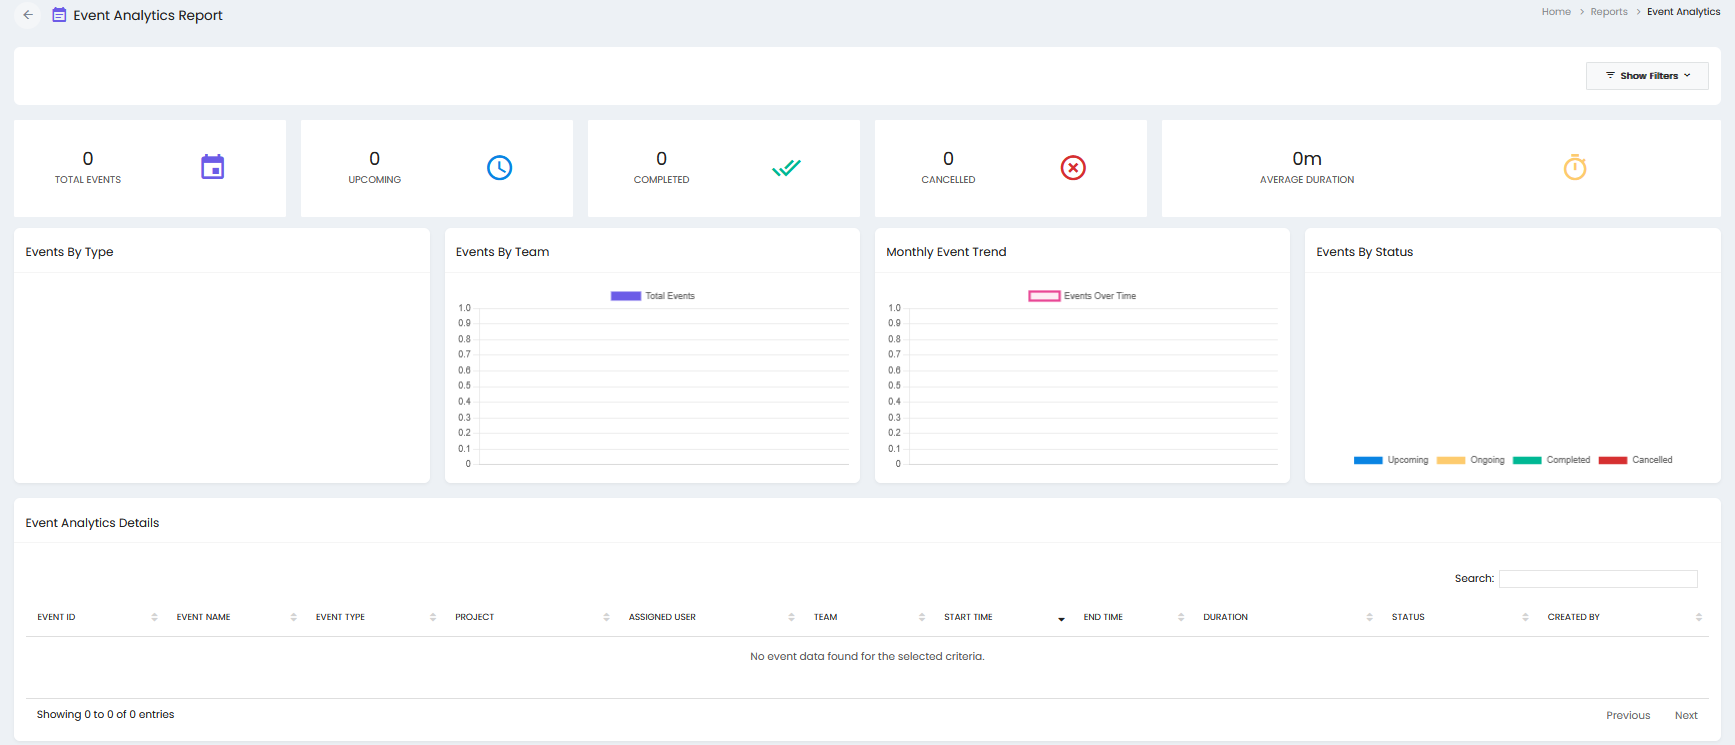
The Event Analytics Report provides an overview of events, including event counts, completion status, duration, team distribution, and event details.
Summary Metrics
- Total Events – Displays the total number of events.
- Upcoming – Displays the number of upcoming events.
- Completed – Displays the number of completed events.
- Cancelled – Displays the number of cancelled events.
- Average Duration – Displays the average duration of events.
Event Analytics Charts
- Events By Type – Displays the distribution of events based on event type.
- Events By Team – Displays the total number of events associated with each team.
- Monthly Event Trend – Displays the event trend over time on a monthly basis.
- Events By Status – Displays events based on their status, including Upcoming, Ongoing, Completed, and Cancelled.
Event Analytics Details
The Event Analytics Details section displays event information in a table with the following columns:
- Event ID – Displays the unique event ID.
- Event Name – Displays the name of the event.
- Event Type – Displays the type of event.
- Project – Displays the project associated with the event.
- Assigned User – Displays the user assigned to the event.
- Team – Displays the team associated with the event.
- Start Time – Displays the event start time.
- End Time – Displays the event end time.
- Duration – Displays the duration of the event.
- Status – Displays the current status of the event.
- Created By – Displays the user who created the event.
Schedule Utilization
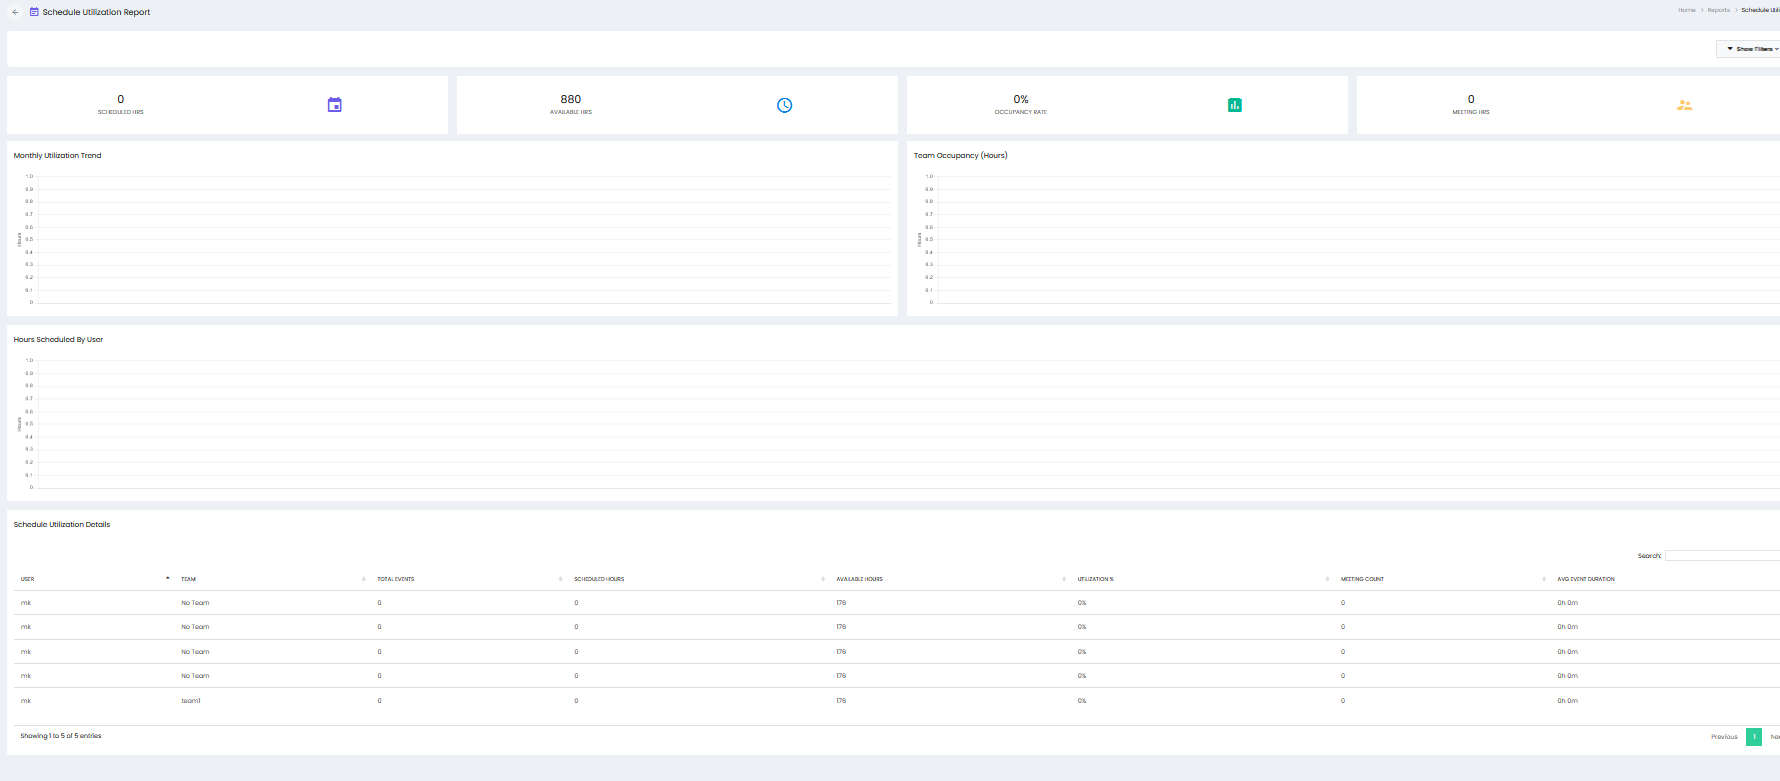
The Schedule Utilization Report provides an overview of scheduled hours, available hours, occupancy, meeting hours, and user-level schedule utilization.
Summary Metrics
- Scheduled Hrs – Displays the total scheduled hours.
- Available Hrs – Displays the total available hours.
- Occupancy Rate – Displays the percentage of occupied hours.
- Meeting Hrs – Displays the total meeting hours.
Schedule Utilization Charts
- Monthly Utilization Trend – Displays the utilization trend based on scheduled hours over time.
- Team Occupancy (Hours) – Displays team occupancy based on hours.
- Hours Scheduled By User – Displays the scheduled hours for each user.
Schedule Utilization Details
The Schedule Utilization Details section displays user-level schedule information in a table with the following columns:
- User – Displays the user name.
- Team – Displays the team associated with the user.
- Total Events – Displays the total number of events associated with the user.
- Scheduled Hours – Displays the total scheduled hours.
- Available Hours – Displays the available hours.
- Utilization % – Displays the user's schedule utilization percentage.
- Meeting Count – Displays the number of meetings.
- Avg Event Duration – Displays the average duration of events.
Search and Filters
- Show Filters – Provides filtering options for the reports.
- Search – Allows users to search for specific event or schedule utilization records.
Pagination
The reports provide pagination controls to navigate between pages of event analytics and schedule utilization records.