


The Project Analytics & Progress report provides an overview of project status, progress, team distribution, and project details.
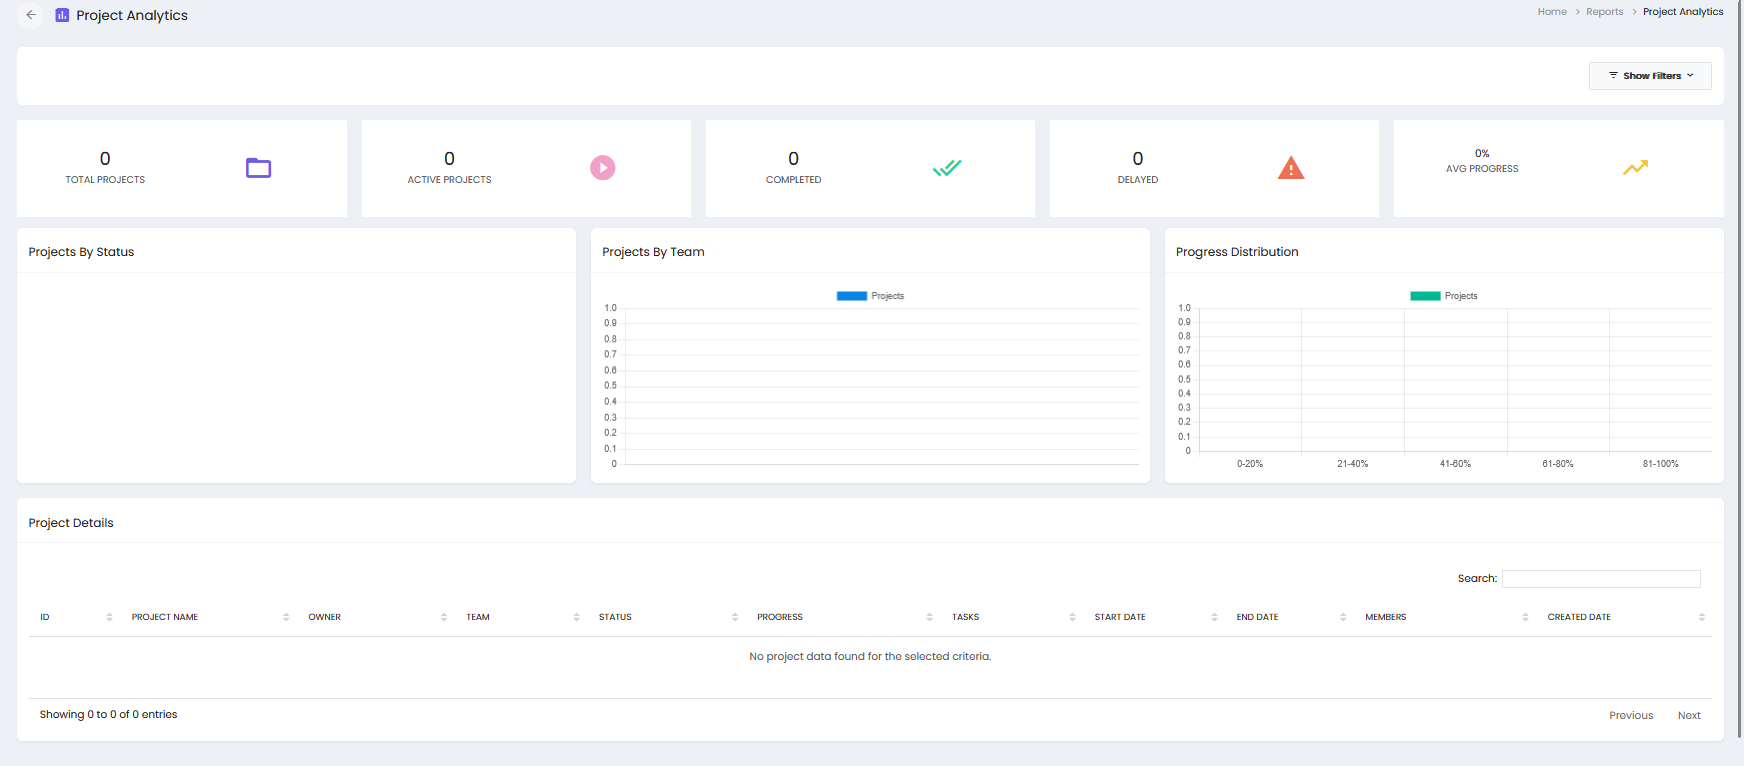
Summary Metrics
- Total Projects – Displays the total number of projects.
- Active Projects – Displays the number of currently active projects.
- Completed – Displays the number of completed projects.
- Delayed – Displays the number of delayed projects.
- Avg Progress – Displays the average progress percentage across projects.
Projects By Status
The Projects By Status section displays the distribution of projects based on their current status.
Projects By Team
The Projects By Team section displays the number of projects associated with each team.
Progress Distribution
The Progress Distribution section displays projects according to their progress ranges:
- 0–20%
- 21–40%
- 41–60%
- 61–80%
- 81–100%
Project Details
The Project Details section displays detailed project information in a table with the following columns:
- ID – Displays the unique project ID.
- Project Name – Displays the name of the project.
- Owner – Displays the project owner.
- Team – Displays the team associated with the project.
- Status – Displays the current project status.
- Progress – Displays the project progress.
- Tasks – Displays the number of tasks associated with the project.
- Start Date – Displays the project start date.
- End Date – Displays the project end date.
- Members – Displays the project members.
- Created Date – Displays the date on which the project was created.
Search and Filters
- Show Filters – Provides filtering options for the report.
- Search – Allows users to search for specific project records in the project details table.
Pagination
The report provides pagination controls to navigate between pages of project records.